4 Data journalism in the age of replication
It’s a single word in a single job description, but a Buzzfeed job posting in 2017 is another indicator in what could be a profound shift in how data journalism is both practiced and taught.
“We’re looking for someone with a passion for news and a commitment to using data to find amazing, important stories — both quick hits and deeper analyses that drive conversations,” the posting seeking a data journalist says. It goes on to list five things BuzzFeed is looking for: Excellent collaborator, clear writer, deep statistical understanding, knowledge of obtaining and restructuring data.
And then there’s this:
“You should have a strong command of at least one toolset that (a) allows for filtering, joining, pivoting, and aggregating tabular data, and (b) enables reproducible workflows.”
The word you’re seeing more and more of? Reproducible. And it started in earnest this summer when data journalism crossed a major threshold in American journalism: It now has it’s own section in the Associated Press Stylebook.
“Data journalism has become a staple of reporting across beats and platforms,” the Data Journalism section of the Stylebook opens. “The ability to analyze quantitative information and present conclusions in an engaging and accurate way is no longer the domain of specialists alone.”
The AP’s Data Journalism section discusses how to request data and in what format, guidelines for scraping data from websites with automation, the ethics of using leaked or hacked data and other topics long part of data journalism conference talks.
But the third page of the section contains perhaps the most profound commandment: “As a general rule, all assertions in a story based on data analysis should be reproducible. The methodology description in the story or accompanying materials should provide a road map to replicate the analysis.”
Reproducible research – replication – is a cornerstone of scientific inquiry. Researchers across a range of academic disciplines use methods to find new knowledge and publish it in peer reviewed journals. And, when it works, other researchers take that knowledge and try it with their own samples in their own locations. Replication studies exist to take something from an Interesting Finding to a Theory and beyond.
It doesn’t always work.
Replication studies aren’t funded at nearly the level as new research. And, to the alarm of many, scores of studies can’t be replicated by others. Researchers across disciplines are finding that when their original studies are replicated, flaws are found, or the effects found aren’t as strong as the original. Because of this, academics across a number of disciplines have written about a replication crisis in their respective fields, particularly psychology, social science and medical research.
In Chapter 1 of the New Precision Journalism, Phil Meyer wrote that “we journalists would be wrong less often if we adapted to our own use some of the research tools of the social scientists.”
Meyer would go on to write about how computers pouring over datasets too large to crunch by hand had changed social science from a discipline with “a few data and a lot of interpretation” into a much more meaningful and powerful area of study. If journalists could become comfortable with data and some basic statistics, they too could harness this power.
“It used to be said that journalism is history in a hurry,” Meyer wrote. “The argument of this book is that to cope with the acceleration of social change in today’s world, journalism must become social science in a hurry.”
He wrote that in 1971. It might as well have been yesterday.
Journalism doesn’t have a history of replication, but the concerns about credibility are substantially greater. Trust in media is at an all time low and shows no signs of improving. While the politics of the day have quite a bit to do with this mistrust of media, being more transparent about what journalists do can’t hurt.
The AP’s commandment that Thou Must Replicate Your Findings could, if taken seriously by the news business, have substantial impacts on how data journalism gets done in newsrooms and how data journalism gets taught, both at professional conferences and universities.
How? Two ways.
- The predominant way that data journalism gets done in a newsroom is through simple tools like Microsoft Excel or Google Sheets. Those simple tools, on their own, lack significant logging functions, meaning journalists will have to maintain detailed logs of what they did so any analysis can be replicated.
- The predominant way that data journalism gets taught – both in professional settings and at most universities – doesn’t deal with replication at all. The tools and the training stress Getting Things Done – an entirely logical focus for a deadline driven business. The choices of tools – like spreadsheets – are made to get from data to story as quick as possible, without frightening away math and tech phobic students.
If the AP’s replication rules are to be followed, journalism needs to become much more serious about the tools and techniques used to do data journalism. The days of Point and Click tools to do Quick and Dirty analysis that get published are dying. The days of formal methods using documented steps are here.
4.1 The stylebook
Troy Thibodeaux, the editor of the AP’s data journalism team, said the stylebook entry started when the data team found themselves answering the same questions over and over. With a grant from the Knight Foundation, the team began to document their own standards and turn that into a stylebook section.
From the beginning, they had a fairly clear idea of what they wanted to do – think through a project and ask what the frequently asked questions are that came up. It was not going to be a soup-to-nuts guide to how to do a data project.
When the section came out, eyebrows went up on the replication parts, surprising Thibodeaux.
“From our perspective, this is a core value for us,” he said. “Just for our own benefit, we need to be able to have someone give us a second set of eyes. We benefit from that every day. We catch things for each other.”
Thibodeaux said the AP data team has two audiences when it comes to replication – they have the readers of the work, and members of the collective who may want to do their own work with the data.
“This is something that’s essential to the way we work,” he said. “And it’s important in terms of transparency and credibility going forward. We thought it would be kind of unexceptionable.”
4.2 Replication
Meyer, now 86, said he’s delighted to see replication up for discussion now, but warned that we shouldn’t take it too far.
“Making the analysis replicable was something I worried about from the very beginning,” he wrote in an email. So much so that in 1967, after publishing stories from his landmark survey after the Detroit riots, he shipped the data and backup materials about it to a social science data repository at the University of North Carolina.
And, in doing so, he opened the door to others replicating his results. One scholar attempted to find fault with Meyer’s analysis by slicing the data ever thinner until the differences weren’t significant – gaming the analysis to criticize the stories.
Meyer believes replication is vitally important, but doesn’t believe it should take on the trappings of science replication, where newsrooms take their own samples or re-survey a community. That would be prohibitively expensive.
But journalists should be sharing their data and analysis steps. And it doesn’t need to be complicated, he said.
“Replication is a theoretical standard, not a requirement that every investigator duplicate his or her own work for every project,” he said. “Giving enough information in the report to enable another investigator to follow in your footsteps is enough. Just telling enough to make replication possible will build confidence.”
But as simple as that sounds, it’s not so simple. Ask social scientists.
Andrew Gelman, a professor of statistics and political science and director of the Applied Statistics Center at Columbia University, wrote in the journal CHANCE in February that difficulties with replication in empirical research are pervasive.
“When an outsider requests data from a published paper, the authors will typically not post or send their data files and code, but instead will point to their sources, so replicators have to figure out exactly what to do from there,” Gelman wrote. “End-to-end replicability is not the norm, even among scholars who actively advocate for the principles of open science.”
So goes science, so goes journalism.
Until a recent set of exceptions, journalists rarely shared data. The “nerd box” – a sidebar story that explains how a news organization did what they did – is a term that first appeared on NICAR-L, a email listserv of data journalists, in the 1990s.
It was a form born in print.
As newsrooms adapted to the internet, some news organizations began linking to their data sources if they were online. Often, the data used in stories were obtained through records requests. Sometimes, reporters created the data themselves.
Journalism, more explicitly than science, is a competitive business. There have been arguments that nerd boxes and downloadable links give too much away to competitors.
Enter the AP Stylebook.
The AP Stylebook argues explicitly for both internal and external replication. Externally, they argue that the “methodology description in the story or accompanying materials should provide a road map to replicate the analysis”, meaning someone else could do the replication post publication.
Internally, the AP Stylebook says: “If at all possible, an editor or another reporter should attempt to reproduce the results of the analysis and confirm all findings before publication.”
There are two problems here.
First is that journalism, unlike science, has no history of replication. There is no Scientific Method for stories. There is no Research Methods class taught at every journalism school, at least not where it comes to writing stories. And, beyond that, journalism school isn’t a requirement to get into the news business. In other words, journalism lacks the standards other disciplines have.
The second problem is, in many ways, worse: Except for the largest newsrooms, most news organizations lack editors who could replicate the analysis. Many don’t have a second person who would know what to do.
Not having a second set of eyes in a newsroom is a problem, Thibodeaux acknowledges. Having a data journalism team “is an incredible luxury” at the AP, he said, and their rule is nothing goes on the wire without a second set of eyes.
Thibodeaux, for his part, wants to see fewer “lone nerds in the corner” – it’s too much pressure. That person gets too much credibility from people who don’t understand what they do, and they get too much blame when a mistake is made.
So what would replication look like in a newsroom? What does this mean for how newsrooms do data journalism on deadline? And what does this mean for how data journalism is being taught, particularly at a time when only half of accredited journalism programs teach any data journalism at all?
Are we walking ourselves into our own replication crisis?
4.3 Goodbye Excel?
For decades, Excel has been the gateway drug for data journalists, the Swiss Army knife of data tools, the One Tool You Can’t Live Without. Investigative Reporters and Editors, an organization that trains investigative journalists, have built large amounts of their curricula around Excel. Of the journalism schools that teach data journalism, most of them begin and end with spreadsheets.
The Stylebook says at a minimum, today’s data journalists should keep a log that details:
- The source of the data, making sure to work on a copy of the data and not the original file.
- Data dictionaries or any other supporting documentation of the data.
- “Description of all steps required to transform the data and perform the analysis.”
The trouble with Excel is, unless you are keeping meticulous notes on what steps you are taking, there’s no way to keep track. Many data journalists will copy and paste the values of a formula over the formula itself to prevent Excel from fouling up cell references when moving data around – a practical step that also cuts off another path to being able to replicate the results.
An increasing number of data journalists are switching to tools like analysis notebooks, which use languages like Python and R, to document their work. The notebooks, generally speaking, allow a data journalist to mix code and explanation in the same document.
Combined with online sharing tools like GitHub, analysis notebooks seem to solve the problem of replication. But the number using them is small compared to those using spreadsheets. Recent examples of news organizations using analysis notebooks include the Los Angeles Times, the New York Times, FiveThirtyEight, and Buzzfeed.
Peter Aldous, a data journalist at Buzzfeed recently published a story about how the online news site used machine learning to find airplanes being used to spy on people in American cities. Published with the story is the code Aldous used to build his case.
“I think of it this way: As a journalist, I don’t like to simply trust what people tell me. Sometimes sources lie. Sometimes they’re just mistaken. So I like to verify what I’m told,” he wrote in an email. “By the same token, why should someone reading one of my articles believe my conclusions, if I don’t provide the evidence that explains how I reached them?”
The methodology document, associated code and source data took Aldous a few hours to create. The story, from the initial data work through the reporting required to make sense of it all, took a year. Aldous said there wasn’t a discussion about if the methodology would be published because it was assumed – “it’s written into our DNA at BuzzFeed News.”
“My background is in science journalism, and before that (way back in the 1980s) in science,” Aldous said. “In science, there’s been a shift from descriptive methods sections to publishing data and analysis code for reproducible research. And I think we’re seeing a similar shift in data journalism. Simply saying what you’ve done is not as powerful as providing the means for others to repeat and build on your work.”
Thibodeaux said that what Buzzfeed and others do with analysis notebooks and code repositories that include their data is “lovely.”
“That to me is the shining city on the hill,” Thibodeaux said. “We’re not going to get there, and I don’t think we have to for every story and every use case, and I don’t think it’s necessarily practical for every person working with data to get to that point.”
There’s a wide spectrum of approaches that still gets journalists to the essence of what the stylebook is trying to do, Thibodeaux said. There are many tools, many strategies, and the AP isn’t going to advocate for any single one of them, he said. They’re just arguing for transparency and replicability, even if that means doing more work.
“There’s a certain burden that comes with transparency,” he said. “And I think we have to accept that burden.”
The question, Thibodeaux said, is what is sufficient? What’s enough transparency? What does someone need for replicability?
“Maybe we do have to set a higher standard – the more critical the analysis is to the story, and the more complex that analysis is, that’s going to push the bar on what is a sufficient methodology statement,” he said. “And it could end up being a whole code repo in order to just say, this isn’t black magic, here’s how we got it if you’re so interested.”
4.4 “Receptivity … is high”
Though written almost half a century ago, Meyer foresaw how data journalism was going to arrive in the newsroom.
“For the new methods to gain currency in journalism, two things must happen,” he wrote. “Editors must feel the need strongly enough to develop the in-house capacity for systematic research … The second need, of course, is for the editors to be able to find the talent to fill this need.”
Meyer optimistically wrote that journalism schools were prepared to provide that talent – they were not then, and only small handful are now – but students were unlikely to be drawn to these new skills if they didn’t see a chance to use those skills in their careers.
It’s taken 45 years, but we are now at this point.
“The potential for receptivity, especially among the younger generation of newspaper managers, is high,” Meyer wrote.
4.5 Replication in notebooks
For our purposes in this book, replication requires two things from you, the student: What and why. What is this piece of code doing, and why are you doing that here and now? What lead you to this place? That you can copy and paste code from this book or the internet is not impressive. What is necessary for learning is that you know what a piece of code is doing a thing and why you want to do that thing here.
In an R Notebook, there are two blocks: A block that uses markdown, which has no special notation, and a code block. The code blocks can run mulitple languages inside R Studio, including Python, a general purpose scripting language; and SQL, or Structured Query Language, the language of databases.
For the rest of the class, we’re going to be working in notebooks. In notebooks, you will both run your code and explain each step, much as I am doing here.
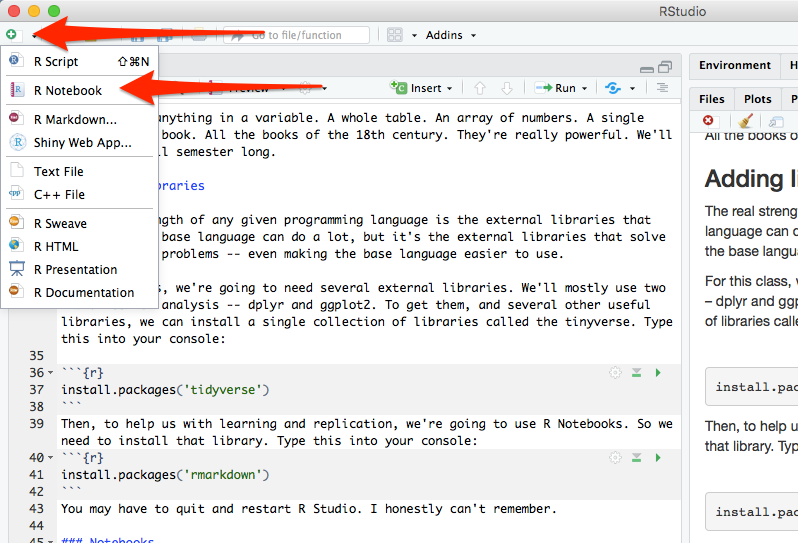
To start a notebook, you click on the green plus in the top left corner and go down to R Notebook. Do that now.
You will see that the notebook adds a lot of text for you. It tells you how to work in notebooks – and you should read it. The most important parts are these:
To add text, simply type. To add code you can click on the Insert button on the toolbar or by pressing Cmd+Option+I on Mac or Ctl+Alt+I on Windows.
Highlight all that text and delete it. You should have a blank document. This document is called a R Markdown file – it’s a special form of text, one that you can style, and one you can include R in the middle of it. Markdown is a simple markup format that you can use to create documents. So first things first, let’s give our notebook a big headline. Add this:
# My awesome notebook
Now, under that, without any markup, just type This is my awesome notebook.
Under that, you can make text bold by writing It is **really** awesome.
If you want it italics, just do this on the next line: No, it's _really_ awesome. I swear.
To see what it looks like without the markup, click the Preview or Knit button in the toolbar. That will turn your notebook into a webpage, with the formatting included.
Throughout this book, we’re going to use this markdown to explain what we are doing and, more importantly, why we are doing it. Explaining your thinking is a vital part of understanding what you are doing.
That explaination, plus the code, is the real power of notebooks. To add a block of code, follow the instructions from above: click on the Insert button on the toolbar or by pressing Cmd+Option+I on Mac or Ctl+Alt+I on Windows.
In that window, use some of the code from above and add two numbers together. To see it run, click the green triangle on the right. That runs the chunk. You should see the answer to your addition problem.
And that, just that, is the foundation you need to start this book.